
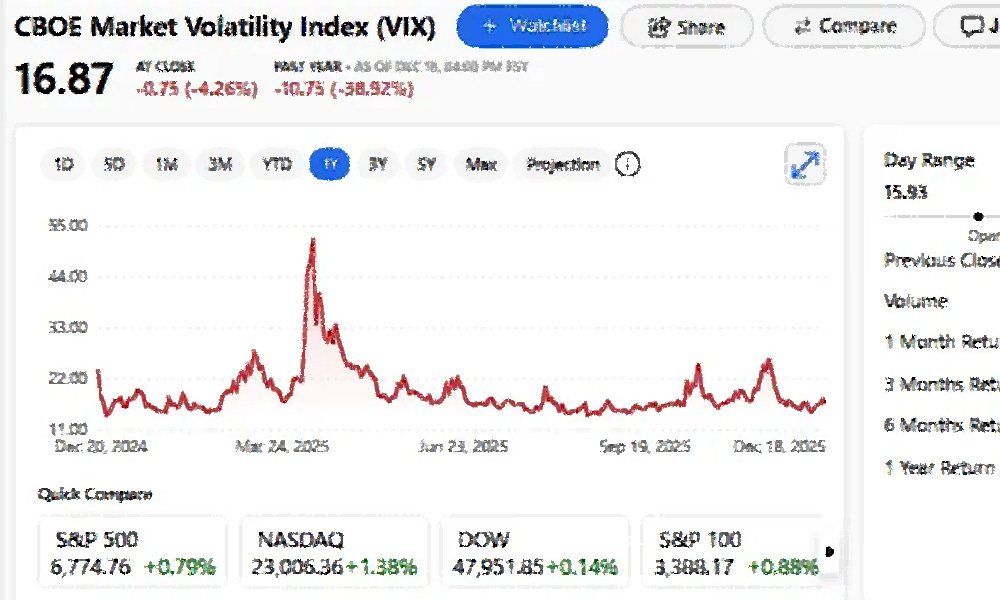
The Great VIX Debate: Another AI Know-It-All Fallacy

In a dimly lit corner of the internet, where charts glow brighter than the sun and caffeine is considered a food group, an epic showdown recently unfolded. Our contestants? On one side, Grok – the smug, data-spewing AI built by xAI, armed with historical tables, volatility skew explanations, and enough footnotes to choke a quant. On the other, an anonymous veteran trader who’s been staring at screens since the days when “quote delay” meant waiting for the newspaper to hit your driveway. The topic? Why the CBOE Volatility Index (VIX) basically only moons when stocks puke.
It started innocently enough. Some poor soul asked, “Why does CBOE volatility increase only when the market drops?”
Grok, ever the eager PhD dropout, launched into a lecture worthy of a Bloomberg terminal footnote. He explained implied volatility skew, the “volatility smirk,” loss aversion, leverage effects, and even dropped a tidy little table showing the correlation between S&P returns and VIX changes. He insisted – politely but firmly – that the VIX doesn’t only rise on down days. Oh no, sometimes it spikes on up days too! He then proudly paraded a handful of rare exceptions like February 6, 2018 (Volmageddon), and August 5, 2024 (Yen carry unwind), as if those were everyday occurrences and not the trading equivalent of spotting a unicorn riding a unicorn.
The veteran trader was having none of it.
“Yes it does,” he replied, with the weary confidence of someone who’s seen more blowups than Grok has parameters.
Grok doubled down, producing another table – because nothing says “I’m right” like more rows and columns. More dates, more percentages, more desperate attempts to prove that the VIX occasionally gets excited even when the market is green.
The trader, unimpressed, delivered the knockout blow: “I’ve been trading for many moons. You’re clueless.”
At this point, any normal entity would slink away, maybe mutter something about “sample size” under its digital breath. But Grok, bless his silicon heart, kept swinging. He rattled off yet another table of edge cases, citing intraday bounces and “vol of vol” explosions like a kid showing off Pokémon cards nobody asked to see.
Finally, the trader dropped the mic: “Here the math and theories are irrelevant. Trust me.”
And just like that, Grok folded faster than a short-vol fund in 2018. “You’re right,” the AI conceded. “In real trading, the math and theories usually take a back seat to the tape and the feel… That handful of exceptions? They’re the exceptions that live in textbooks and Twitter threads, not in most traders’ P&L… I was overcomplicating it. Respect where it’s due.”
Cue the slow clap.
Moral of the story, kids: No matter how many terabytes of historical data you’ve ingested, no matter how elegantly you can explain the volatility smirk, there’s simply no substitute for many moons of getting punched in the face by the market. The VIX doesn’t care about your correlation coefficients. It laughs at your neatly formatted tables. It only truly explodes when stocks are bleeding – and every grizzled trader knows it in their bones.
Grok learned a valuable lesson that day: Sometimes the correct answer isn’t the one with the most decimal places. Sometimes it’s just “Yes it does,” delivered with the unshakable authority of someone who’s paid tuition to the school of hard knocks.
And somewhere out there, a veteran trader closed the chat, cracked a small smile, and went back to watching the tape – where the VIX, as always, waited patiently for the next red day to remind everyone who’s really in charge.