
Bitcoin & Rabbits: The Magic Of Market Technical Analysis
(Originally written in 2021)

As the market lurches from bear to bull and rockets into the stratosphere—mocking P/E ratios that never made sense—the parade of “fail‑safe” trading systems marches right alongside. Greed inevitably flips to fear, the cycle repeats, and once the wounds are licked, yesterday’s failed systems are dusted off, repackaged, and sold again to the next unsuspecting crowd. After all, there’s always one born every minute.
Anyone who’s ever dabbled in technical analysis knows the madness: a jungle of indicators so dense it makes astrology look disciplined. The imagination becomes the only limit, spawning trading schemes built on vapor, unicorns, and seductive geometric doodles that supposedly chart the future.
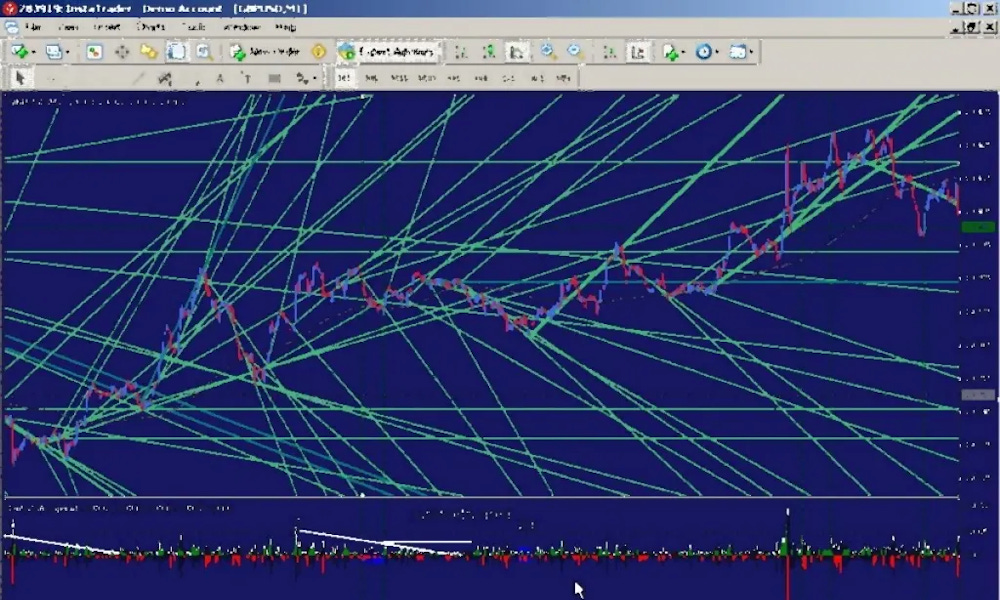
On October 1, 2020, I wandered over to TradingView.com—an undeniably slick playground for chart junkies—and stumbled upon a gem of a headline: “BITCOIN Fibonacci alignment shows a $200,000 Cycle Top!” In other words, math meets prophecy, and suddenly Bitcoin looks less like a currency and more like a cosmic lottery ticket.

It was a wildly amusing yet utterly useless piece of pseudo‑financial artwork, the kind of trading graffiti that practically begs for a takedown of technical analysis. And so, let’s zero in on Fibonacci—the golden spiral of market mysticism that has fascinated me endlessly. Just remember: Bitcoin only showed up in 2009, and the chart in question doesn’t even begin until late 2010.
One day in the early 13th century, Italian mathematician Leonardo Pisano Bigollo—better known as Fibonacci—found himself pondering a burning question about rabbit population growth. His solution produced a curious sequence where each number is the sum of the two before it: 0, 1, 1, 2, 3, 5, 8, 13, 21, 34, 55… and so on. For example, 13 comes from 8 + 5. Of course, credit where it’s due: versions of this sequence had been floating around centuries before Leonardo. Still, he was sharp enough to recognize the superiority of the Hindu‑Arabic numbering system over Roman numerals, which lacked a zero. Imagine buying steak at the market priced at $VIII.X per pound. Decimals didn’t exist either, so I had to invent the Roman equivalent of $8.10. And here’s a side jab: how could the Romans miss the concept of zero, when their empire eventually ended with exactly that—zero power?
As brilliant as Fibonacci was, he didn’t know much about rabbits. Rabbits gestate in 30 days, produce litters of five to eight, and within six months the cycle repeats—except now multiple rabbits are multiplying. Factor in males and females, and the math quickly collapses. Assume two females and three males from a litter of five, each female producing five more, plus the mother’s five, and suddenly you’ve got 17 rabbits. But 17 isn’t the sum of 2 and 7. So much for Fibonacci’s furry experiment.
Rabbits aside, the sequence itself is fascinating. Divide a number by the one before it, and you get roughly 1.61—for instance, 21 ÷ 13. Flip it around, 13 ÷ 21, and you get about 0.61. These ratios echo the Golden Ratio, 1.61803…, an irrational constant dubbed the “Divine Proportion.” For over 2,400 years, people have marveled at its presence in art, architecture, geometry, even human faces.
But Fibonacci Retracement isn’t about the sequence itself—it’s about ratios. Traders take two extremes on a stock chart—a peak and a trough—and slice the vertical distance using “imaginary” Fibonacci percentages: 23.6%, 38.2%, 50%, and 61.8%. The star of the show is 61.8%, derived from the Golden Ratio. It first appears when dividing 34 by 55, and traders treat it as the key level of support or resistance.
The others? 38.2% comes from dividing a number by one two places to the right (55 ÷ 144 = 0.3819). 23.6% comes from dividing by three places to the right (8 ÷ 34 = 0.2352). Add 100% for the peak, 0% for the trough, and 50% as the neat midpoint.
Of course, Fibonacci himself never imagined his sequence being rounded and repurposed this way. As a mathematician, he would have loathed the imprecision. Yet traders swear by these ratios to mark buy and sell zones. Why two and three places to the right, not five to the left? And where does the arbitrary 50% fit? That’s another tale—one involving gophers, polar bears, and a logic as unrelated as it sounds.
Technical analysis only works because traders collectively agree to play by the same rules—like drivers mostly obeying traffic laws. With that in mind, keep it simple. Don’t waste your time on convoluted formulas or psychedelic charts that look like Picasso after a bad trip. Why? Because history already gave us LTCM, the hedge fund where a squad of PhDs nearly toppled the banking system with their “foolproof” mathematical wizardry. Their downfall wasn’t math—it was psychology, the blind spot that economics and central banks never quite manage to solve. And for the record, yes—the Russians really did it to LTCM.